When I first arrived at the Technical University of Munich, I quickly discovered a frustrating problem: there was no centralized way to find underground parties, rooftop concerts, or spontaneous art shows. Event information was scattered everywhere buried in Instagram stories, hidden in obscure Telegram channels, or plastered on half-torn flyers stuck to street corners. As someone who loves building solutions to real problems, my inner engineer couldn't help but wonder: what if there was a map that could literally show you where the action was happening? Instead of playing detective with cryptic hashtags and blurry screenshots, what if you could simply open a map and watch tonight's hotspots come alive in real-time?
That simple idea evolved into PartyMap, an experimental web application that aggregates social media posts, processes them using AI, and visualizes everything on an interactive map. It's equal parts data pipeline, geospatial interface, and adventure into cutting-edge technology. In this post, I'll walk you through the journey of building it: the challenges I tackled, the architecture that makes it tick, and the lessons I learned along the way. Fair warning: it involves significantly more AWS services than I originally anticipated.
The Problem: Scattered Nightlife Discovery
Modern cities pulse with pop-up events and underground culture, but discovering them feels like solving a puzzle with missing pieces. Clubs announce shows on Instagram, promoters bury crucial details deep in story highlights, and people constantly find themselves asking "What's happening tonight?" in group chats, hoping someone else did the legwork. I wanted to tackle two fundamental challenges:
Discoverability. Rather than endlessly scrolling through social media feeds and hoping you don't miss something amazing, users should be able to zoom into their neighborhood and instantly see what's happening around them. Think of it as Foursquare meets event discovery, but actually useful for real-world exploration.
Context. Photos and captions tell a story, but they don't always answer the important questions. Is this a laid-back jazz evening or an intense techno rave? Is it worth crossing the city for? This meant transforming unstructured social media posts into structured, searchable, and meaningful data that actually helps people make decisions.
1class Event(BaseModel):2 id: uuid.UUID = Field(default_factory=uuid.uuid4, description="Unique identifier")3 time: Optional[datetime] = Field(default=None, description="Event timestamp")4 location_str: Optional[str] = Field(default=None, max_length=300)5 location_str_extra: Optional[str] = Field(default=None, max_length=300)6 location_coords: Optional[Tuple[float, float]] = None # (lat, lon)7 description: str = Field("", max_length=1000)8 title: str = Field("", max_length=100)9 account_id: Optional[int] = None10 thumbnail: Optional[AnyUrl] = None11 account_url: Optional[AnyUrl] = None12 carousel: Optional[List[AnyUrl]] = None13 url: Optional[AnyUrl] = None14 post_id: Optional[int] = None15 price: Optional[float] = None16 tags: List[str] = Field(default_factory=list)17 category: Optional[str] = None18 time_uncertain: bool = False19 duration: Optional[float] = Field(default=None, ge=0.0)20 ...Building the Data Pipeline and AI Engine
Creating PartyMap required much more than just dropping pins on a map. At its core lies a sophisticated multi-stage data pipeline that ingests content from social media accounts, enriches it using artificial intelligence, and stores everything in scalable cloud databases. Think of it as an assembly line for processing party intelligence but one that needs to handle the chaos and unpredictability of social media.
Ingesting Posts and Events
The foundation of the system is built on AWS DynamoDB as the primary datastore. I designed separate tables for different types of content: party-map-accounts-table stores social media account information, party-map-events-table holds event metadata, while party-map-images-table and party-map-videos-table manage media references. Additional batch tables track the processing status of posts, accounts, and AI requests throughout the pipeline. The GPTBatch model, for instance, monitors OpenAI batch jobs and tracks whether each job is pending, running, or complete.
Every new post flows through a carefully orchestrated queue system: content is fetched from the source account, assigned to a processing batch, and stored with essential metadata. Batch workers then process these posts asynchronously, ensuring the ingestion pipeline can scale smoothly even when dozens of events are published simultaneously. This batch approach also significantly reduces operational costs, since OpenAI's batch API costs 50% less than real-time processing.
During prototyping, I used Bright Data for controlled scraping tasks to test ingestion flows against publicly visible pages. This was limited to experimental runs and configured to respect robots.txt and platform terms as part of my compliance-first approach.


Enriching Content with AI and Computer Vision
Raw social media posts are inherently messy and unstructured. Text often lacks clear formatting, and images frequently convey more information than their accompanying captions. To extract meaningful insights, PartyMap integrates several AI services working in harmony:
Natural Language Processing. Posts are analyzed and categorized using OpenAI's language models. Each processing job is tracked through the party-map-openai-batch-table, with results linked back to their corresponding events. The AI excels at extracting structured information like event timing, location details, pricing, and event categories from conversational social media text.
Image and Video Analysis. Visual content is processed using AWS Rekognition to detect text overlays and filter out irrelevant posts. The system maintains a dedicated party-map-rekognition-table for storing these analysis results. This automated categorization helps distinguish actual events from general social media noise, ensuring the map stays focused on actionable information.
Account Context. Social media accounts are periodically analyzed in batches to determine their geographic focus and category classification whether that's nightclubs, event promoters, art collectives, or other types of organizers. This contextual understanding dramatically improves the accuracy of event extraction, as new posts inherit intelligent defaults based on their source account's established patterns, like the location of a nightclub.
Why AWS?
Operating a continuously updating map means dealing with unpredictable data streams and sudden traffic spikes. DynamoDB's serverless architecture provides automatic elasticity, I don't need to worry about provisioning capacity or managing scaling during busy Friday nights when everyone posts their weekend plans. S3 handles image and video storage effortlessly, with automatic global distribution through CloudFront's CDN.
Each batch worker runs as an independent Lambda function, allowing the entire pipeline to scale automatically based on the volume of posts waiting for processing. During peak periods, the system spins up dozens of concurrent workers. During quiet hours, it scales down to near-zero operational cost. This elastic approach perfectly matches the unpredictable nature of social media content.
Building this architecture taught me invaluable lessons about modeling data access patterns, handling eventual consistency in distributed systems, and designing idempotent batch operations. That last point proved crucial, posts might get reprocessed due to retries or system failures, so every operation needs to be safe to execute multiple times without causing data corruption or duplication.
Frontend: Creating a Responsive Interactive Experience
While the backend processes vast amounts of data, the frontend focuses on creating an intuitive and delightful user experience. I chose Next.js as the foundation because it combines React's component model with built-in optimizations for modern web applications. Next.js automatically handles code splitting and intelligent routing, ensuring users only download the JavaScript needed for their current page. This keeps load times fast even on slower mobile connections. The framework also integrates seamlessly with React hooks, allowing me to manage complex state like filter preferences and theme switching without unnecessary boilerplate code.
The Map Component
For the map visualization, I implemented Mapbox GL through the react-map-gl library. react-map-gl wraps Mapbox's powerful vector-tile rendering engine in a React-friendly component, making it possible to treat the map like any other React element. The core logic lives in map.tsx, where the component orchestrates map state management, dynamic theme switching, and intelligent event clustering. This approach enables smooth transitions between light and dark modes while efficiently fetching events based on the user's current viewport.
Smart Search and Filtering System
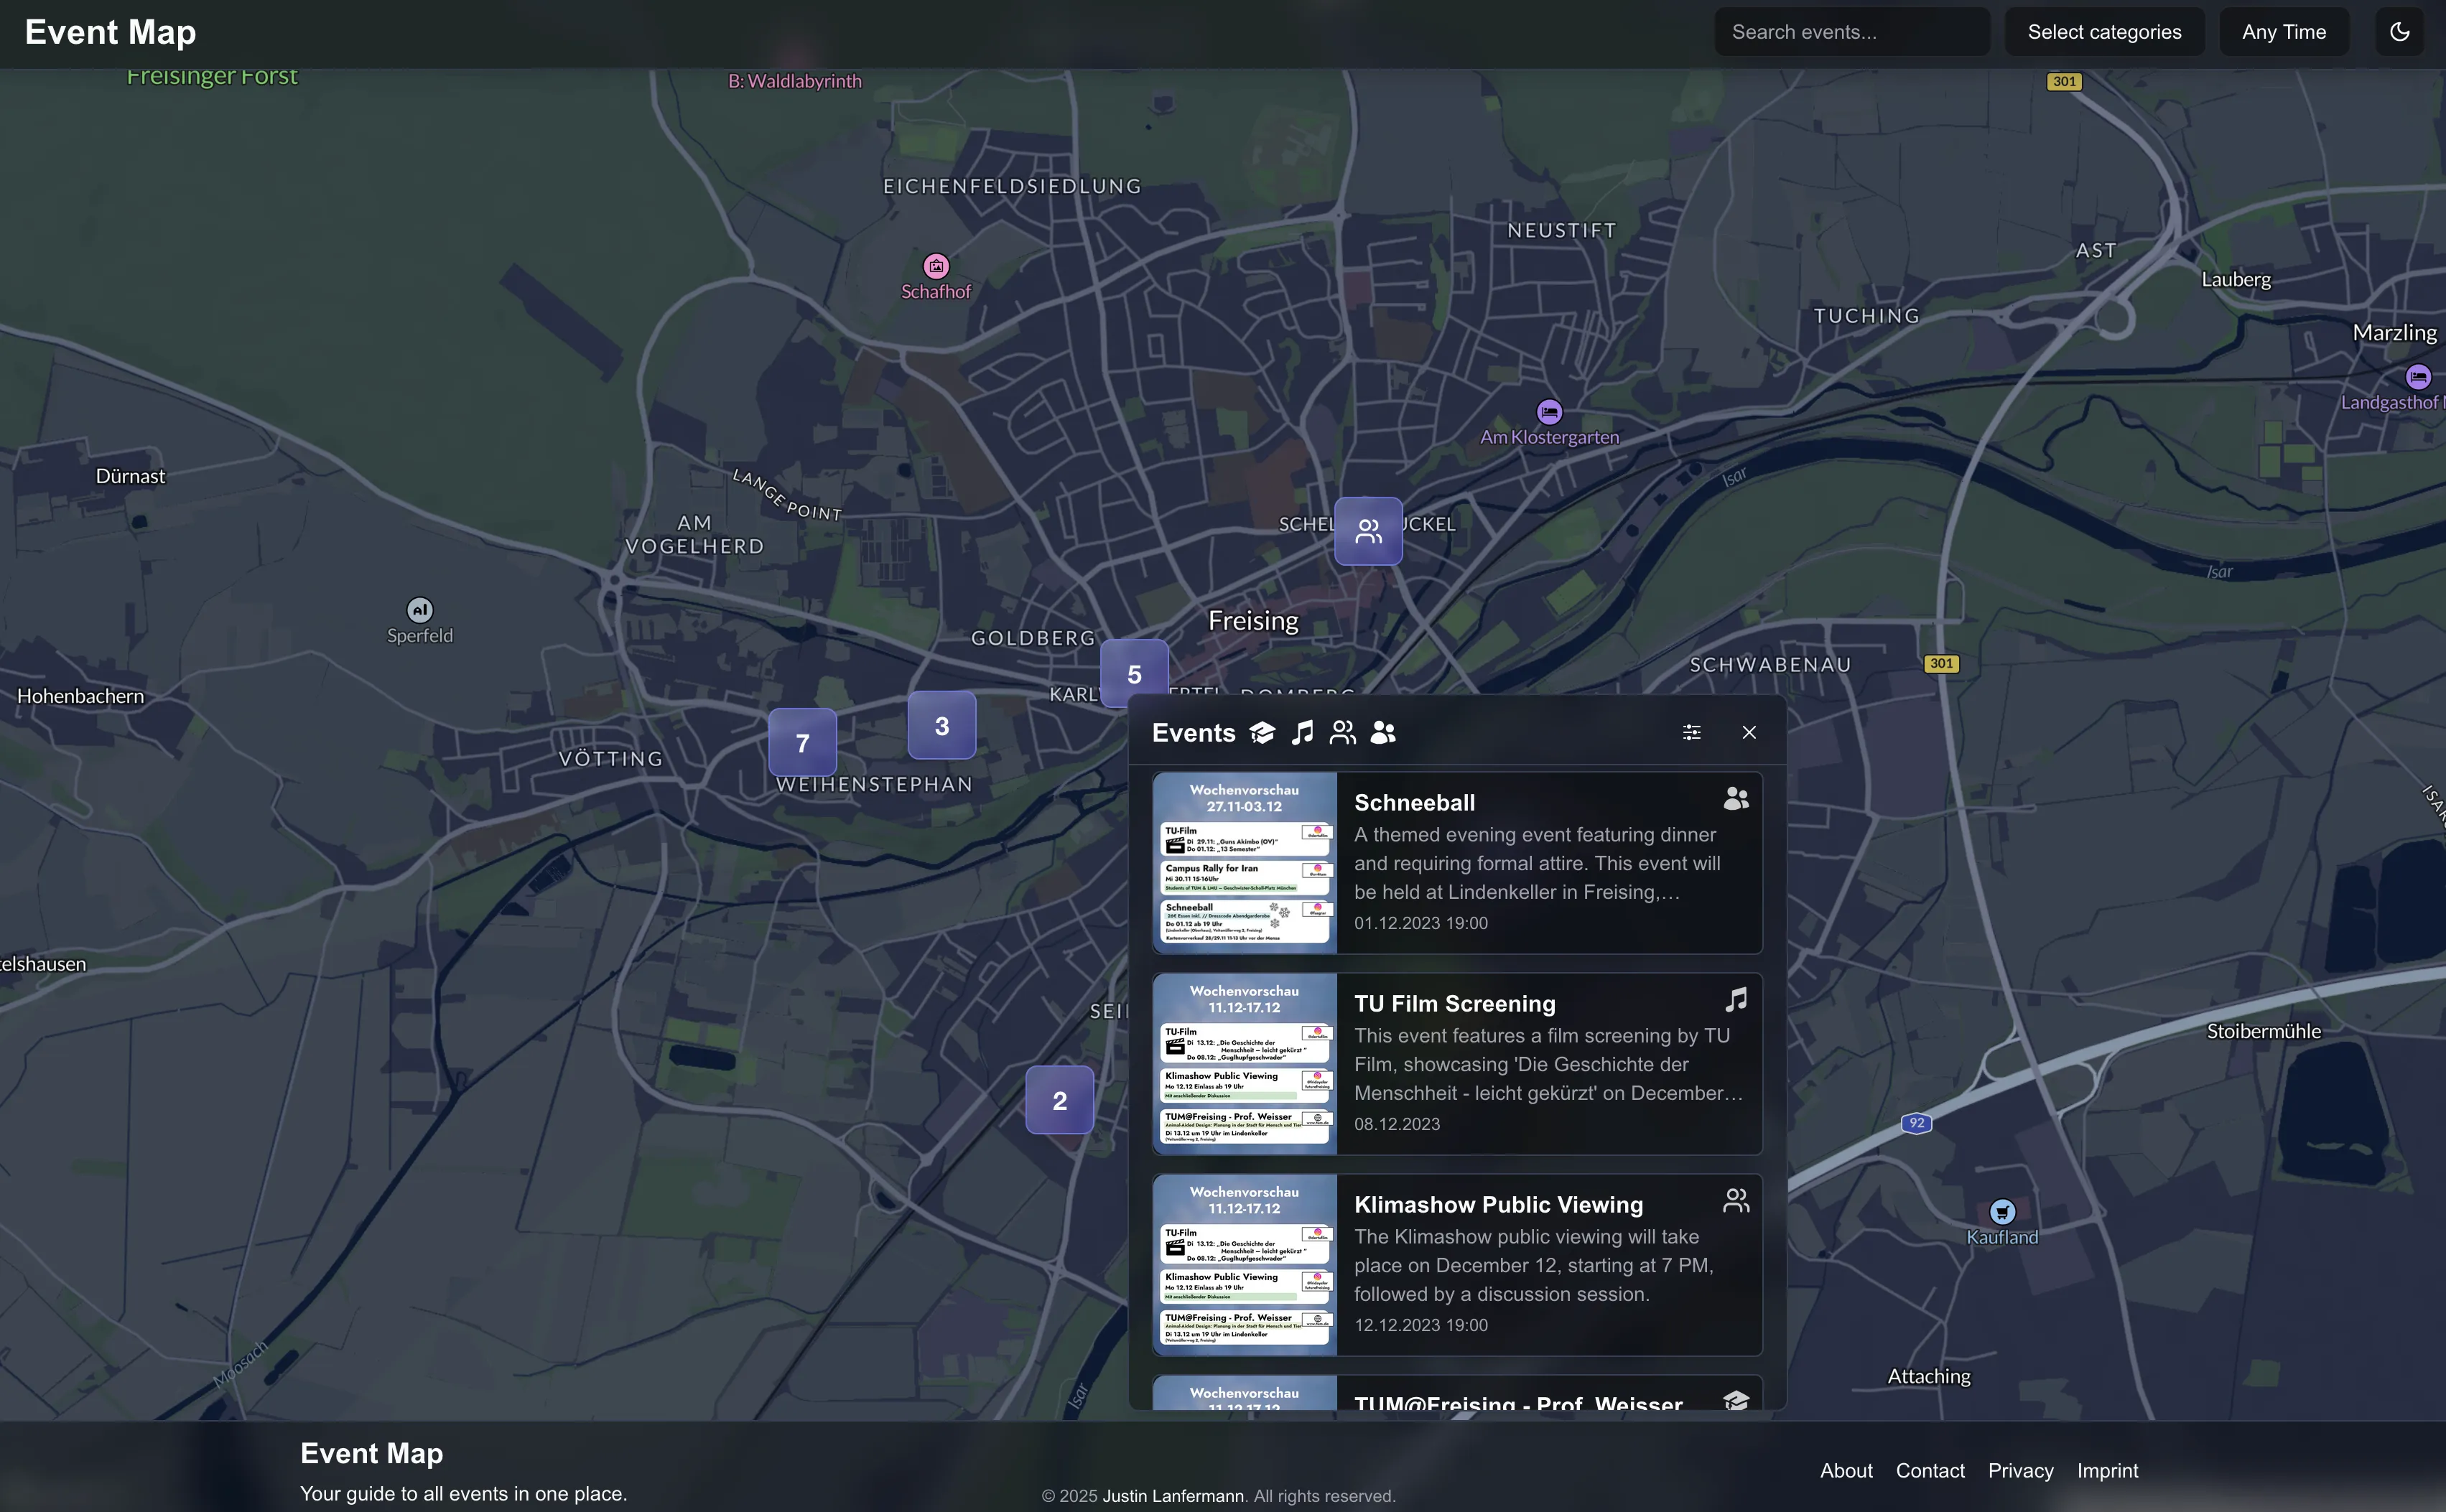
A map crowded with pins quickly becomes overwhelming and counterproductive. Users don't want to see every single event happening in a city, they want to discover their kind of experience. To help people find exactly what they're looking for, I developed a comprehensive filtering system that sits elegantly above the map interface.
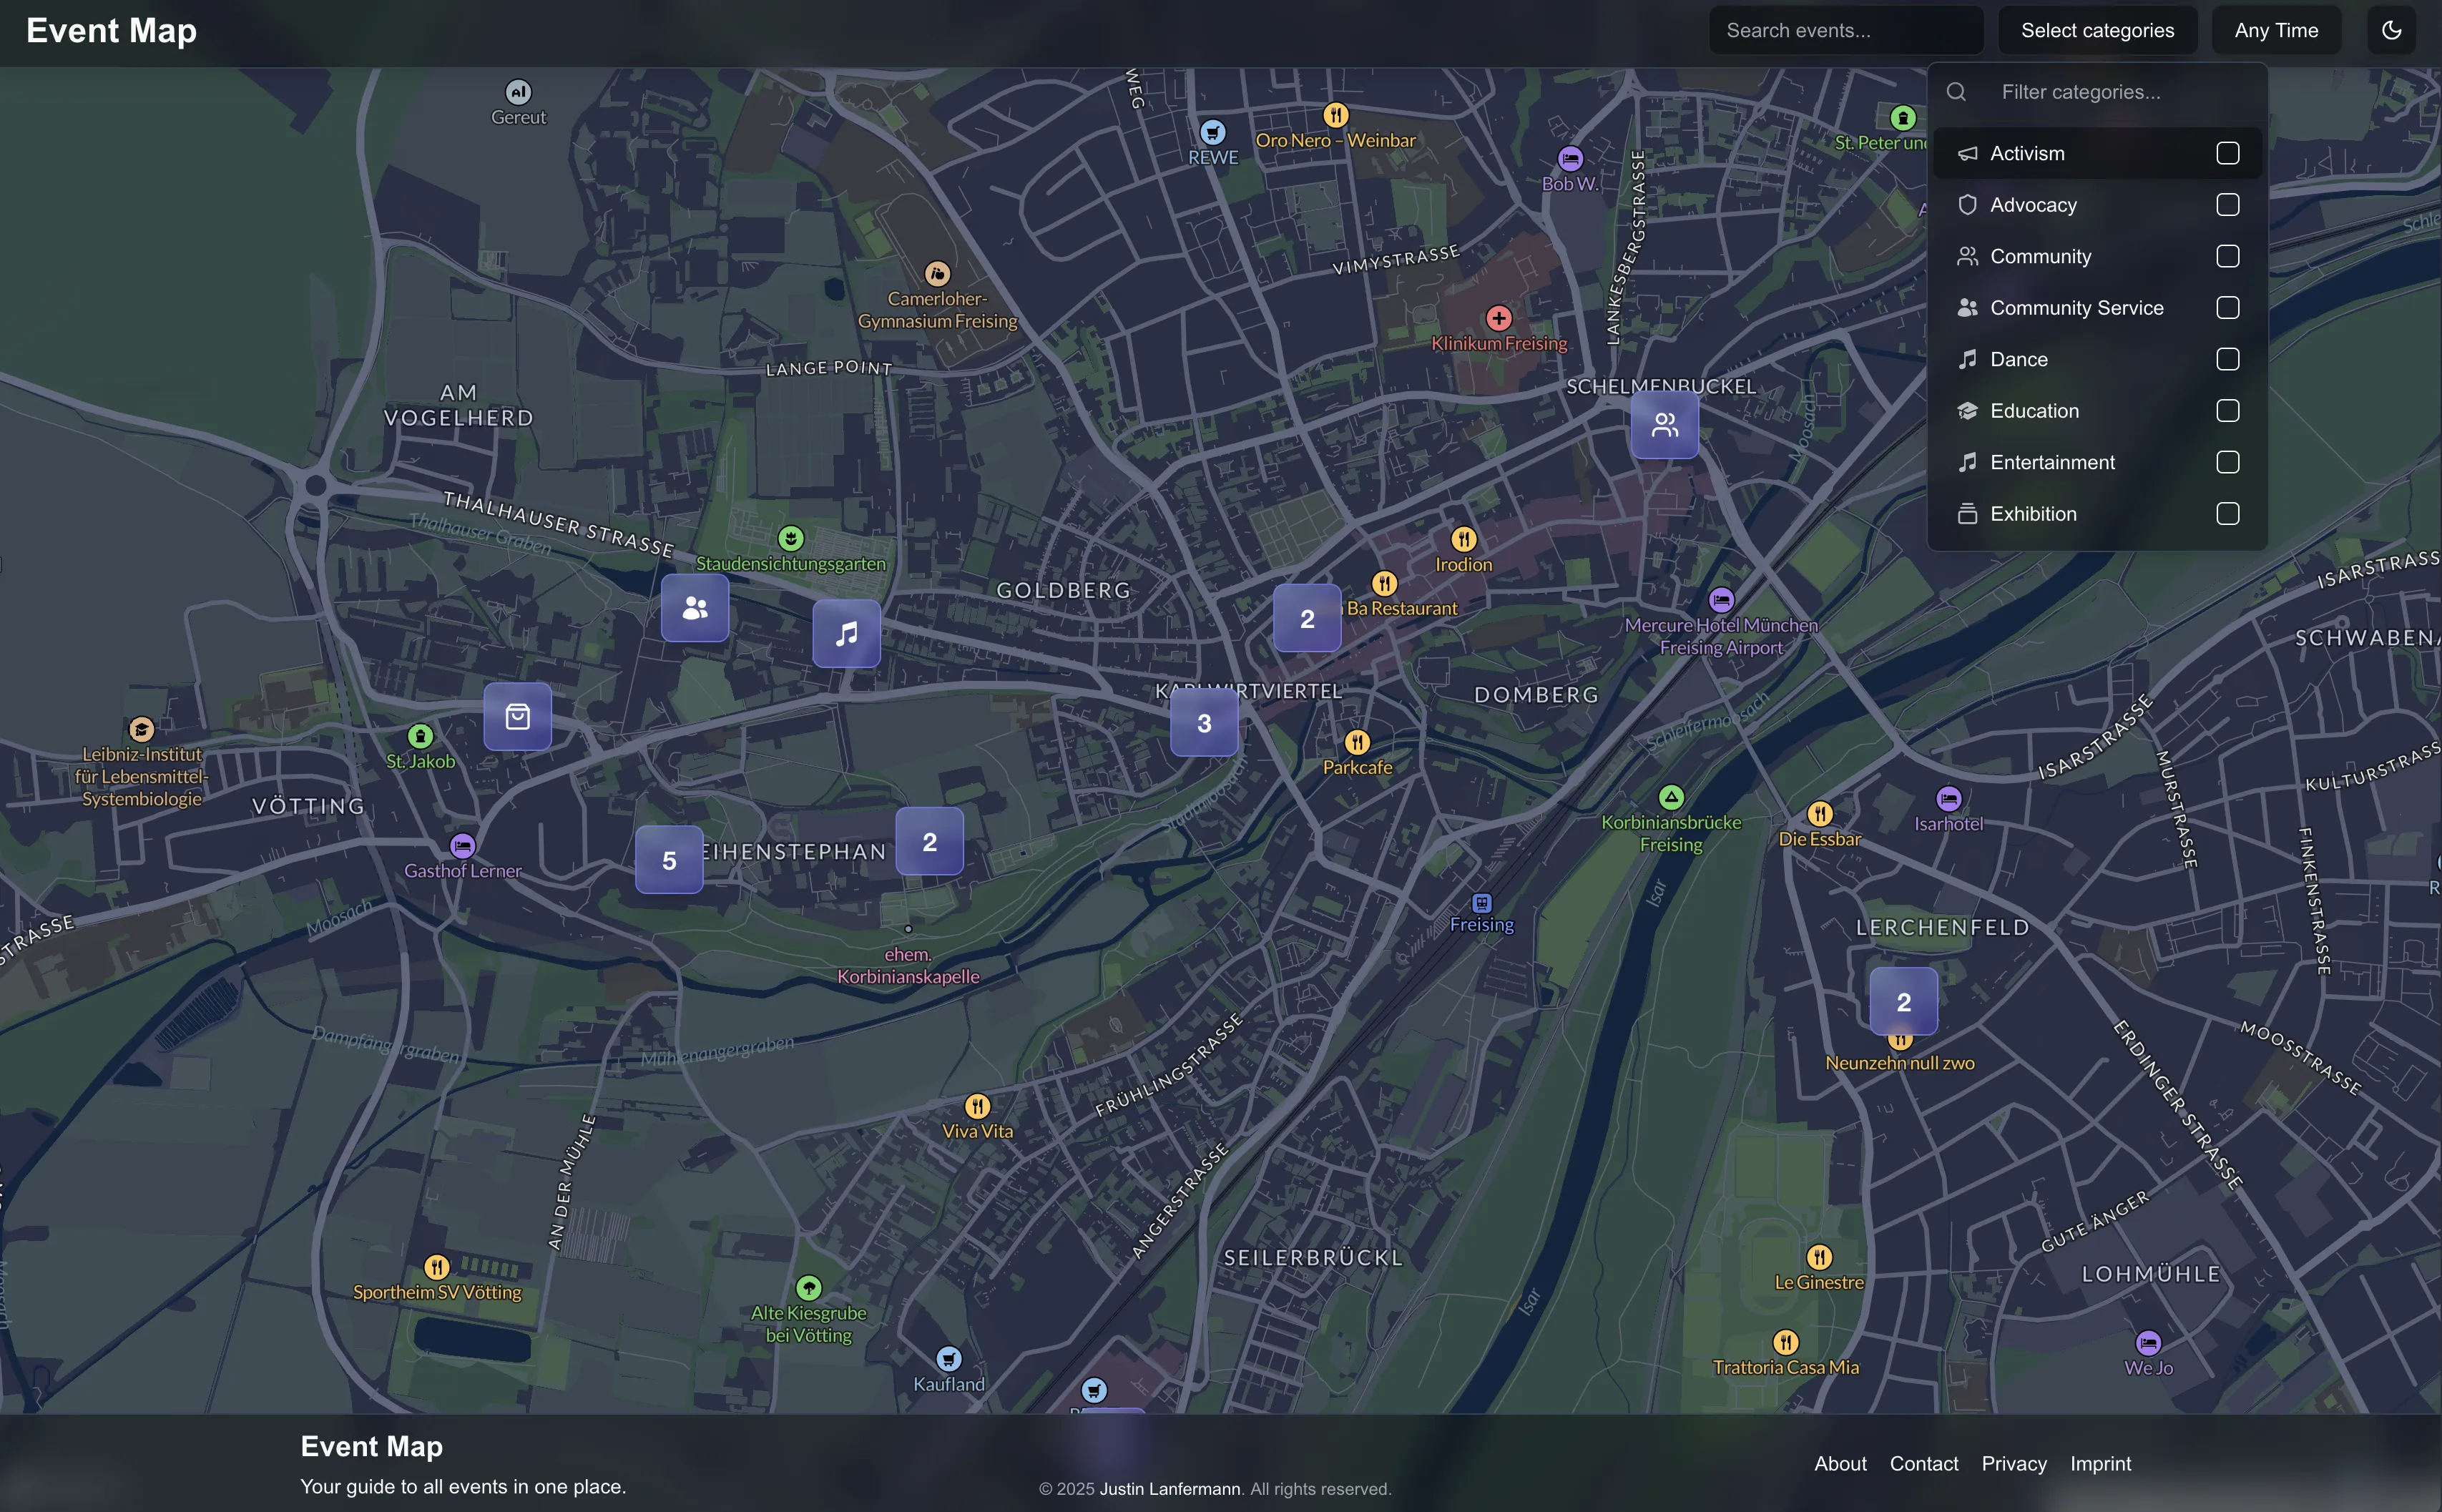
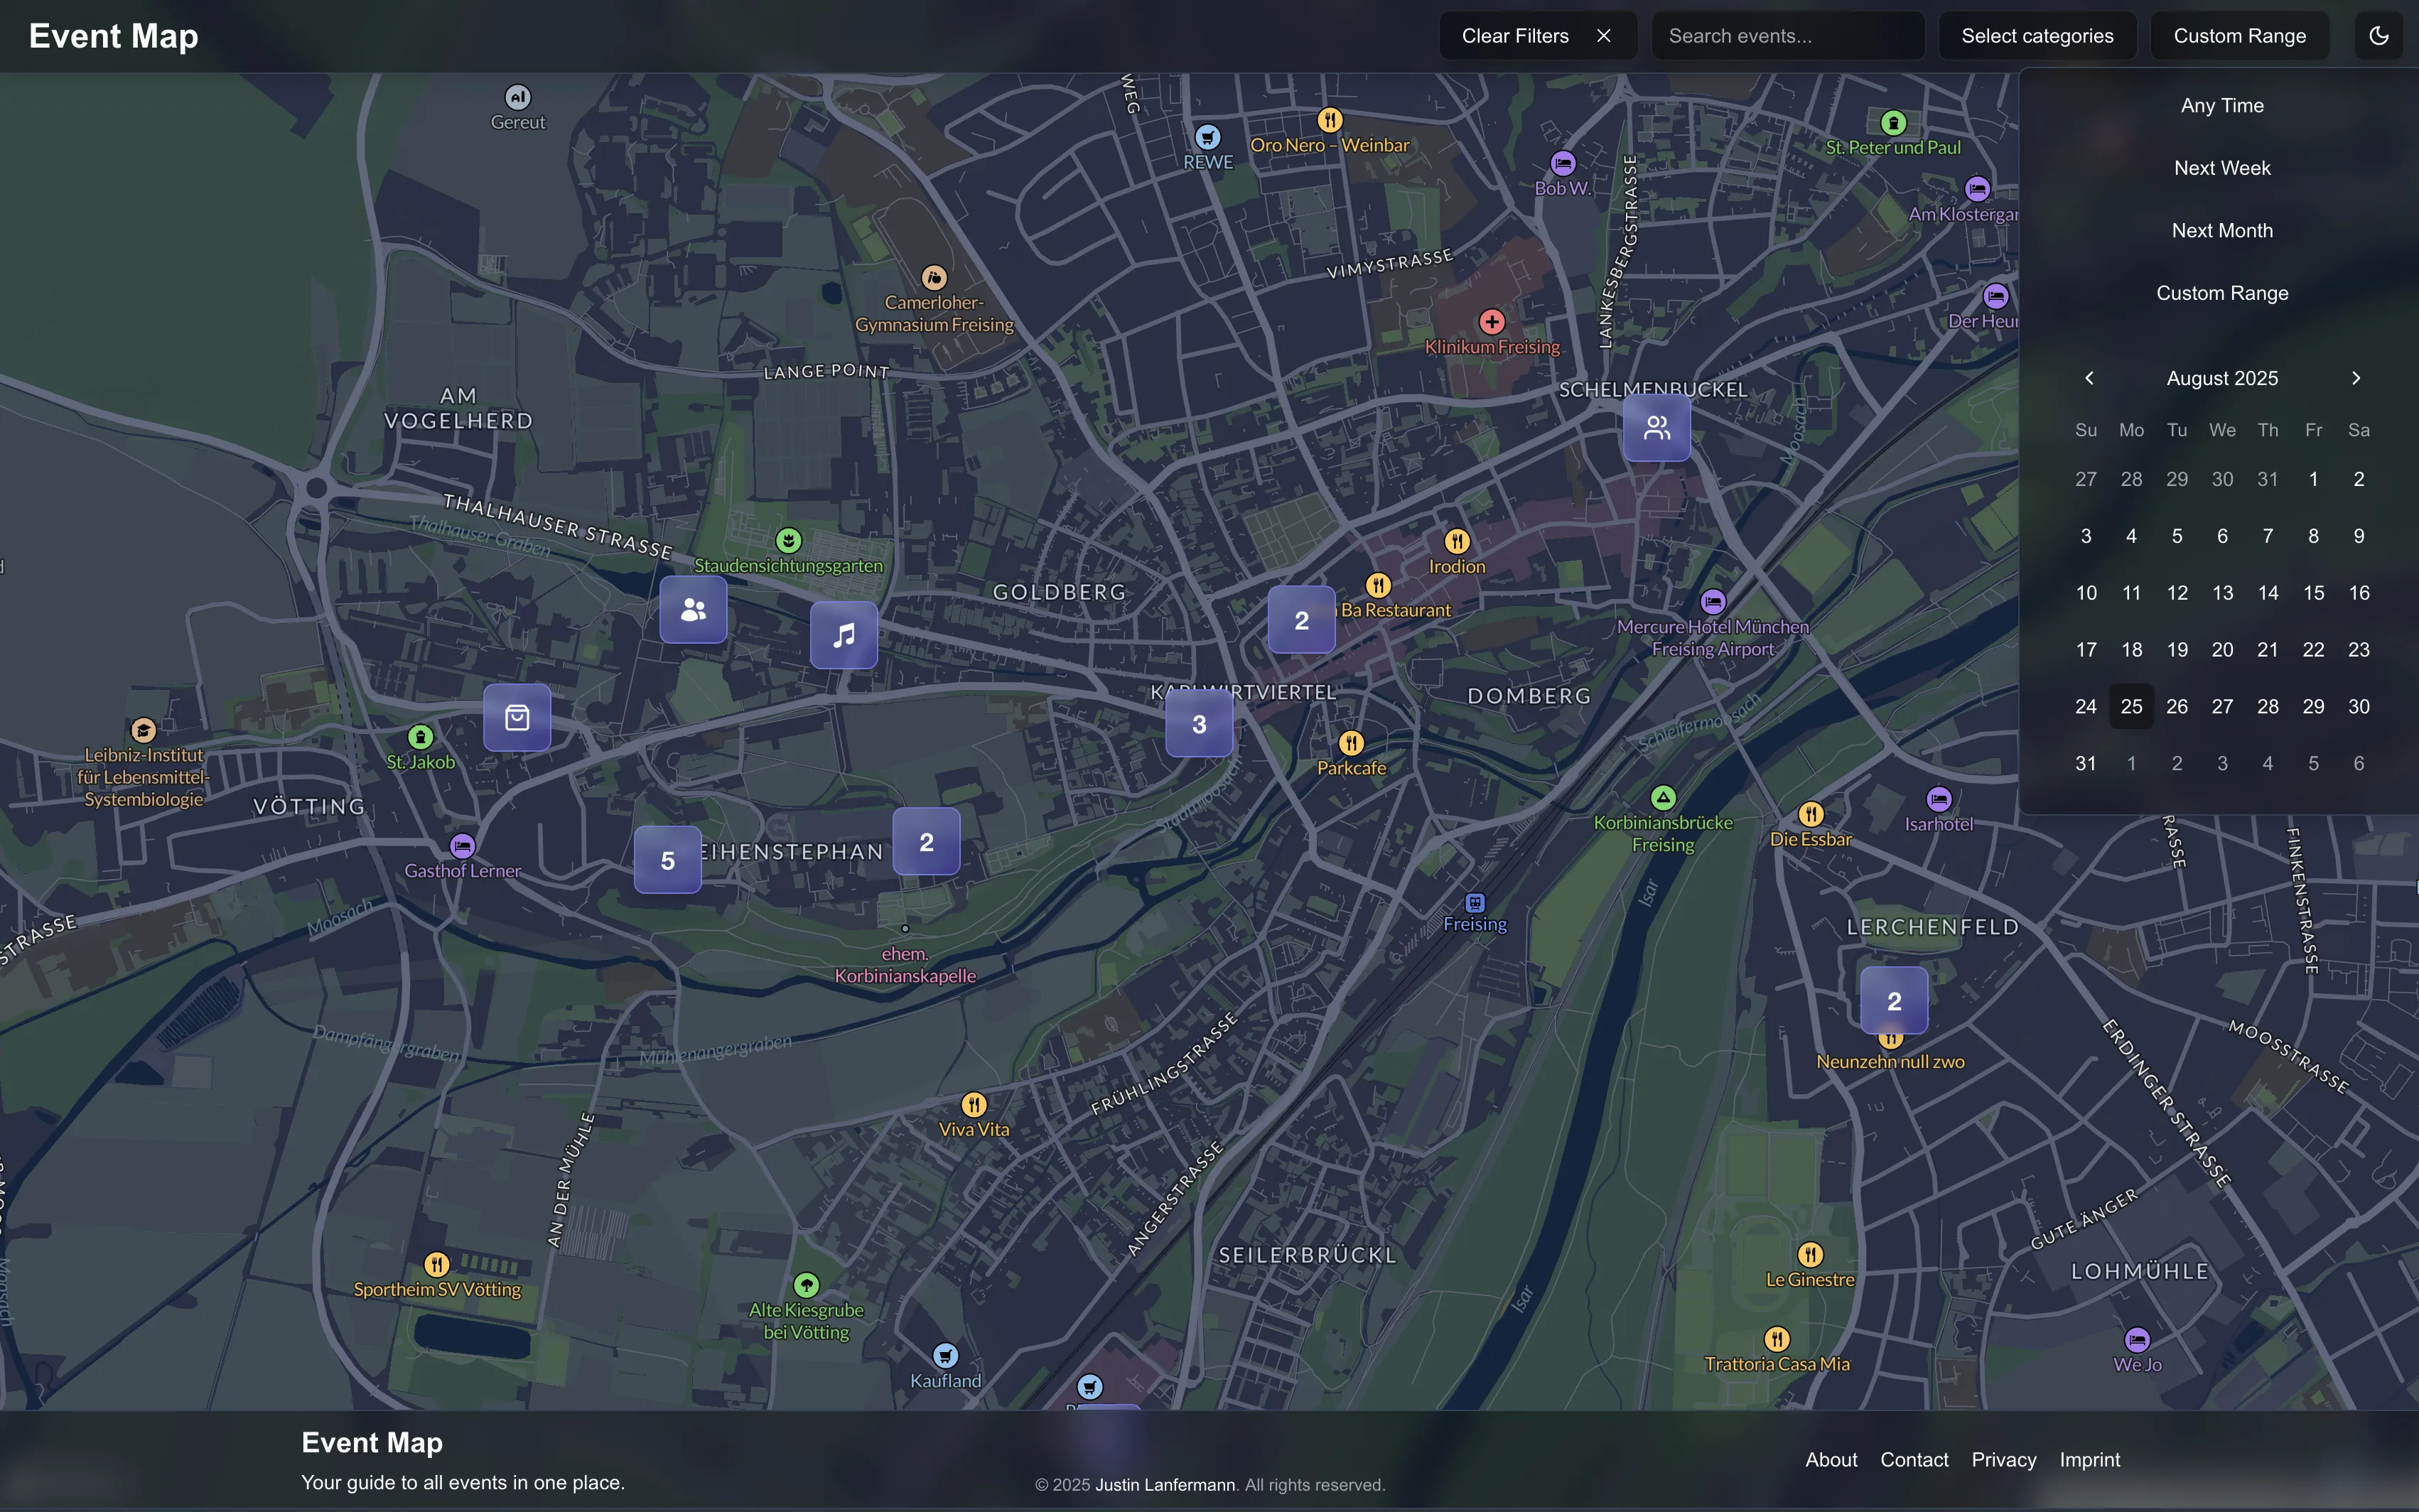
Multi-Layer Filtering Architecture
The filter interface combines three powerful tools: a debounced search input for text queries, an intuitive category selector with individual toggle controls, and flexible time filters ranging from quick presets to custom date ranges. Users can mix and match these filters to create highly specific searches, while a prominent "Clear Filters" button provides instant reset functionality for easy exploration.
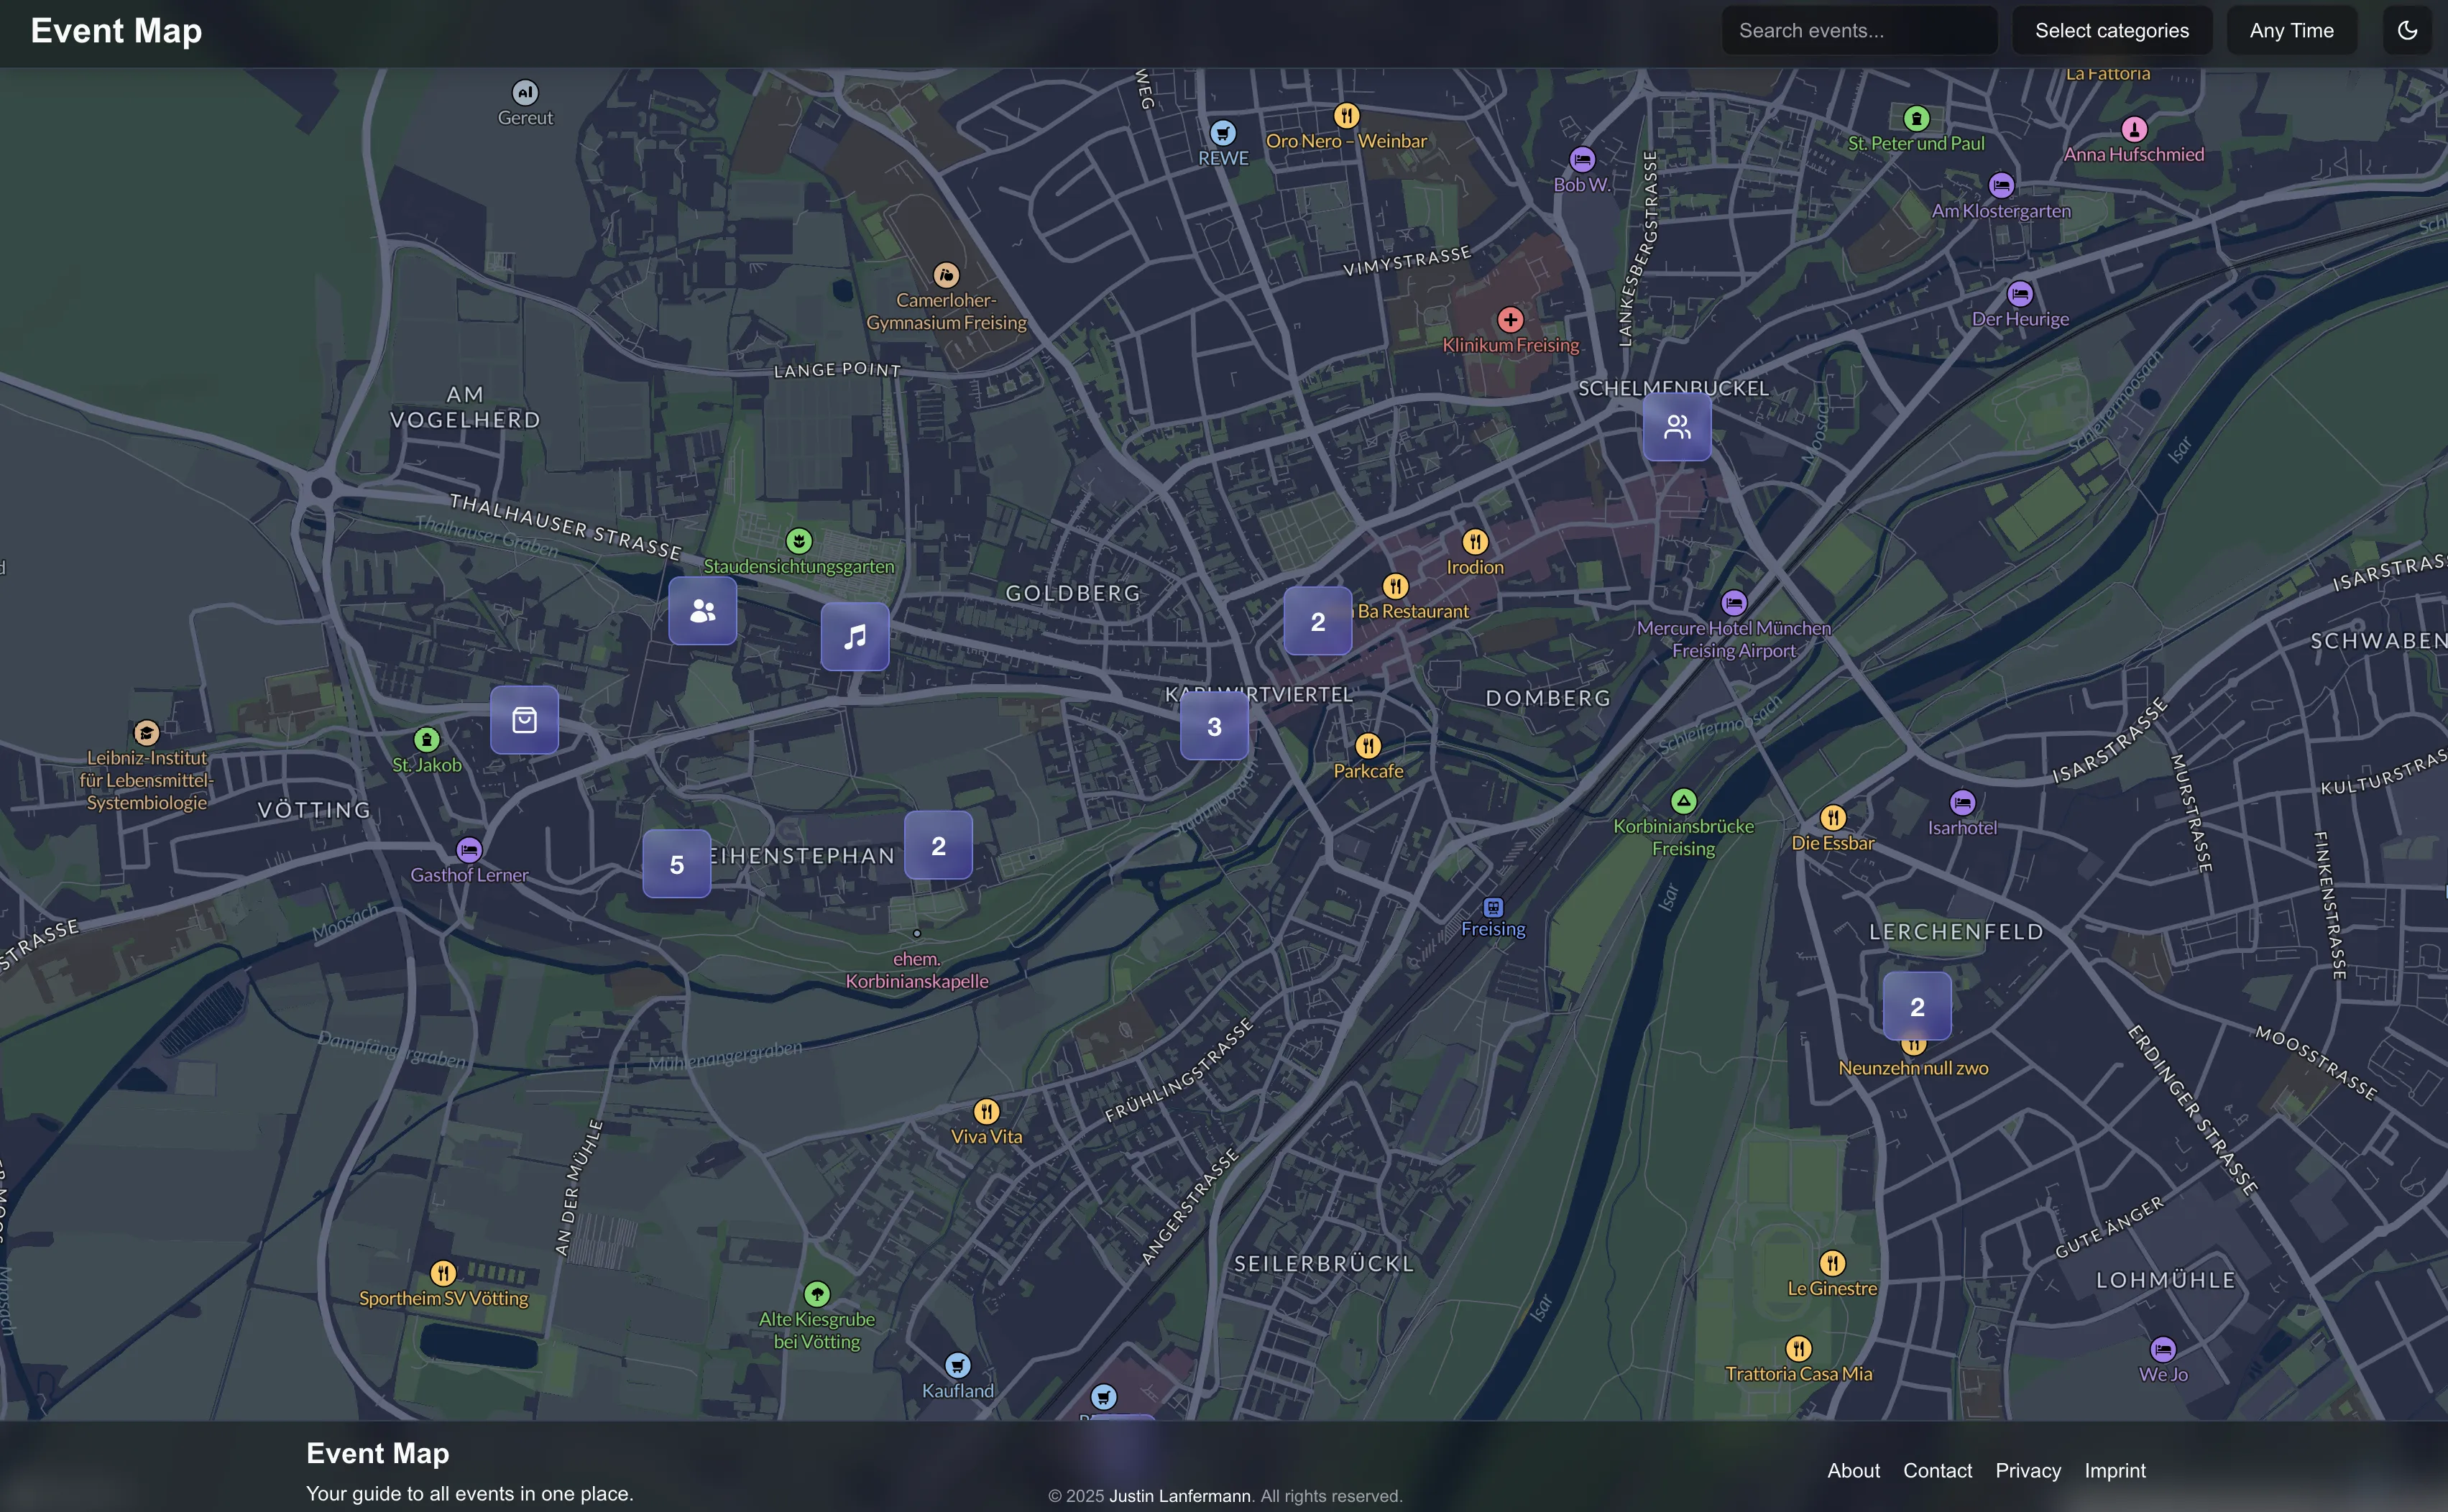
Event Details and User Experience Design
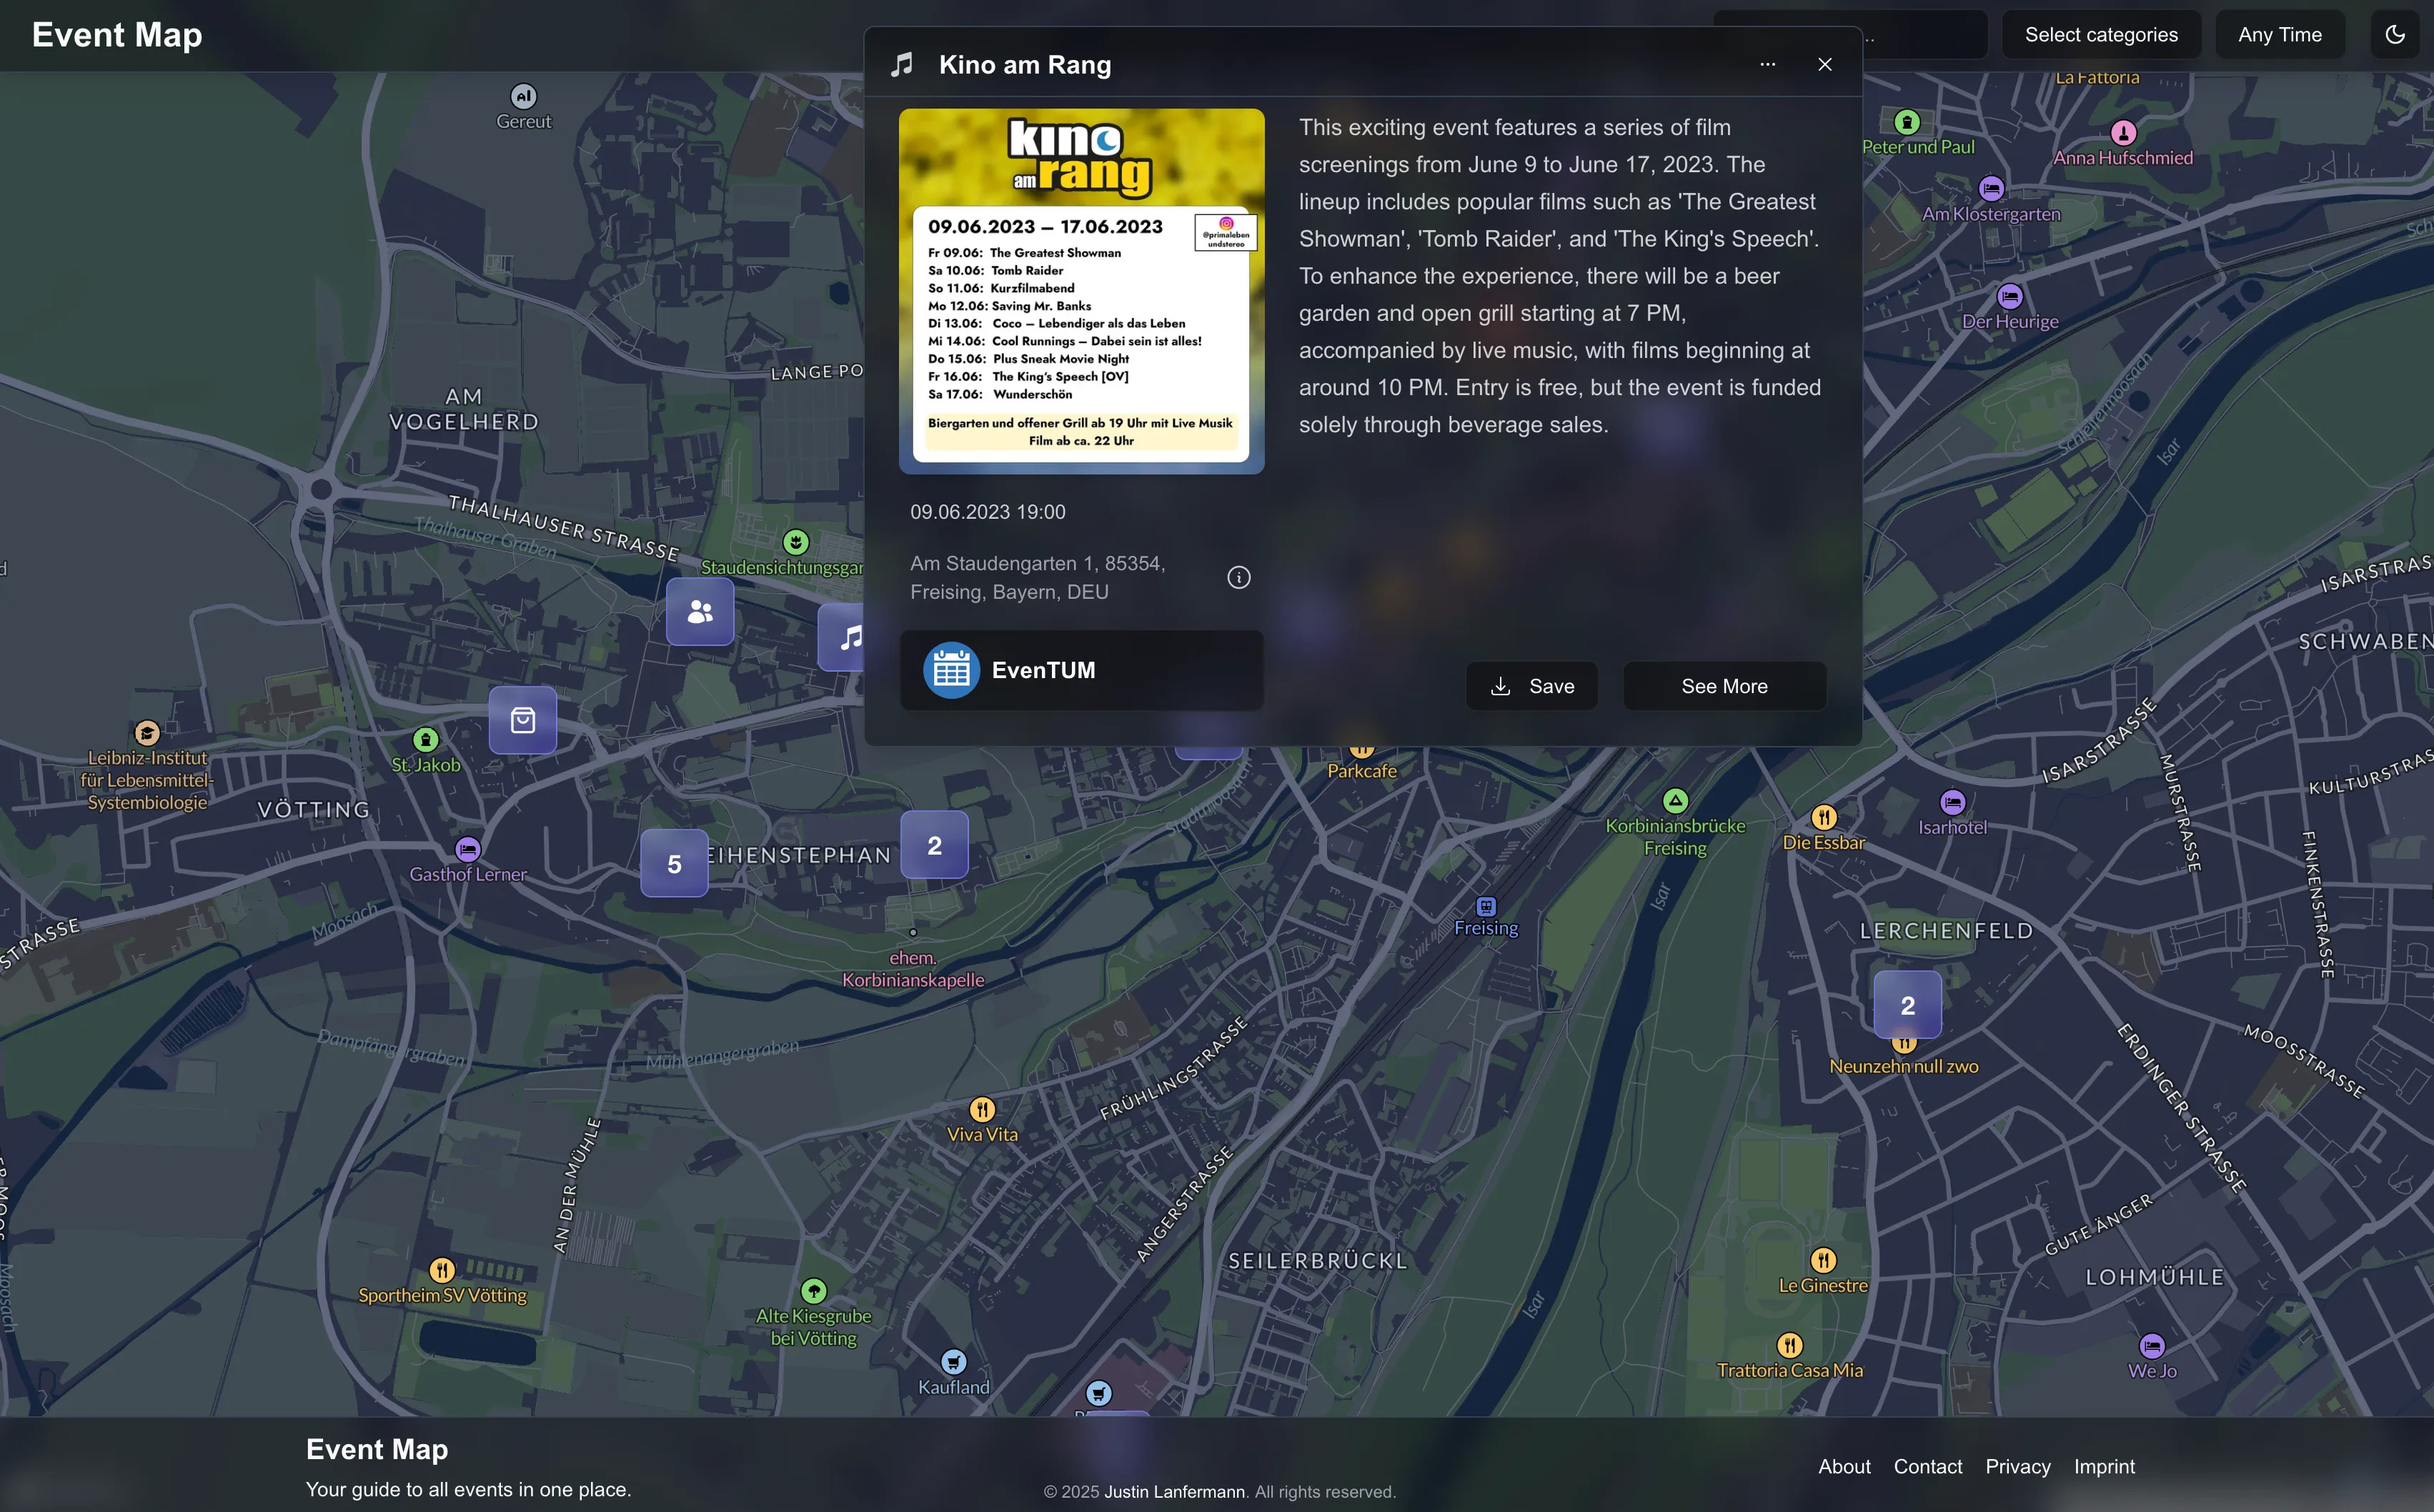
Zooming into any neighborhood reveals a constellation of colored markers, each representing different types of events. The interaction model is intuitive: clicking on event clusters automatically zooms in for better detail, while clicking individual markers opens rich information panels. These detail views include event posters, AI-generated summaries, timing information, pricing details, venue addresses, and actionable buttons for Save, Add to Calendar, and See More functionality.
Account Pages and Organizer Hubs
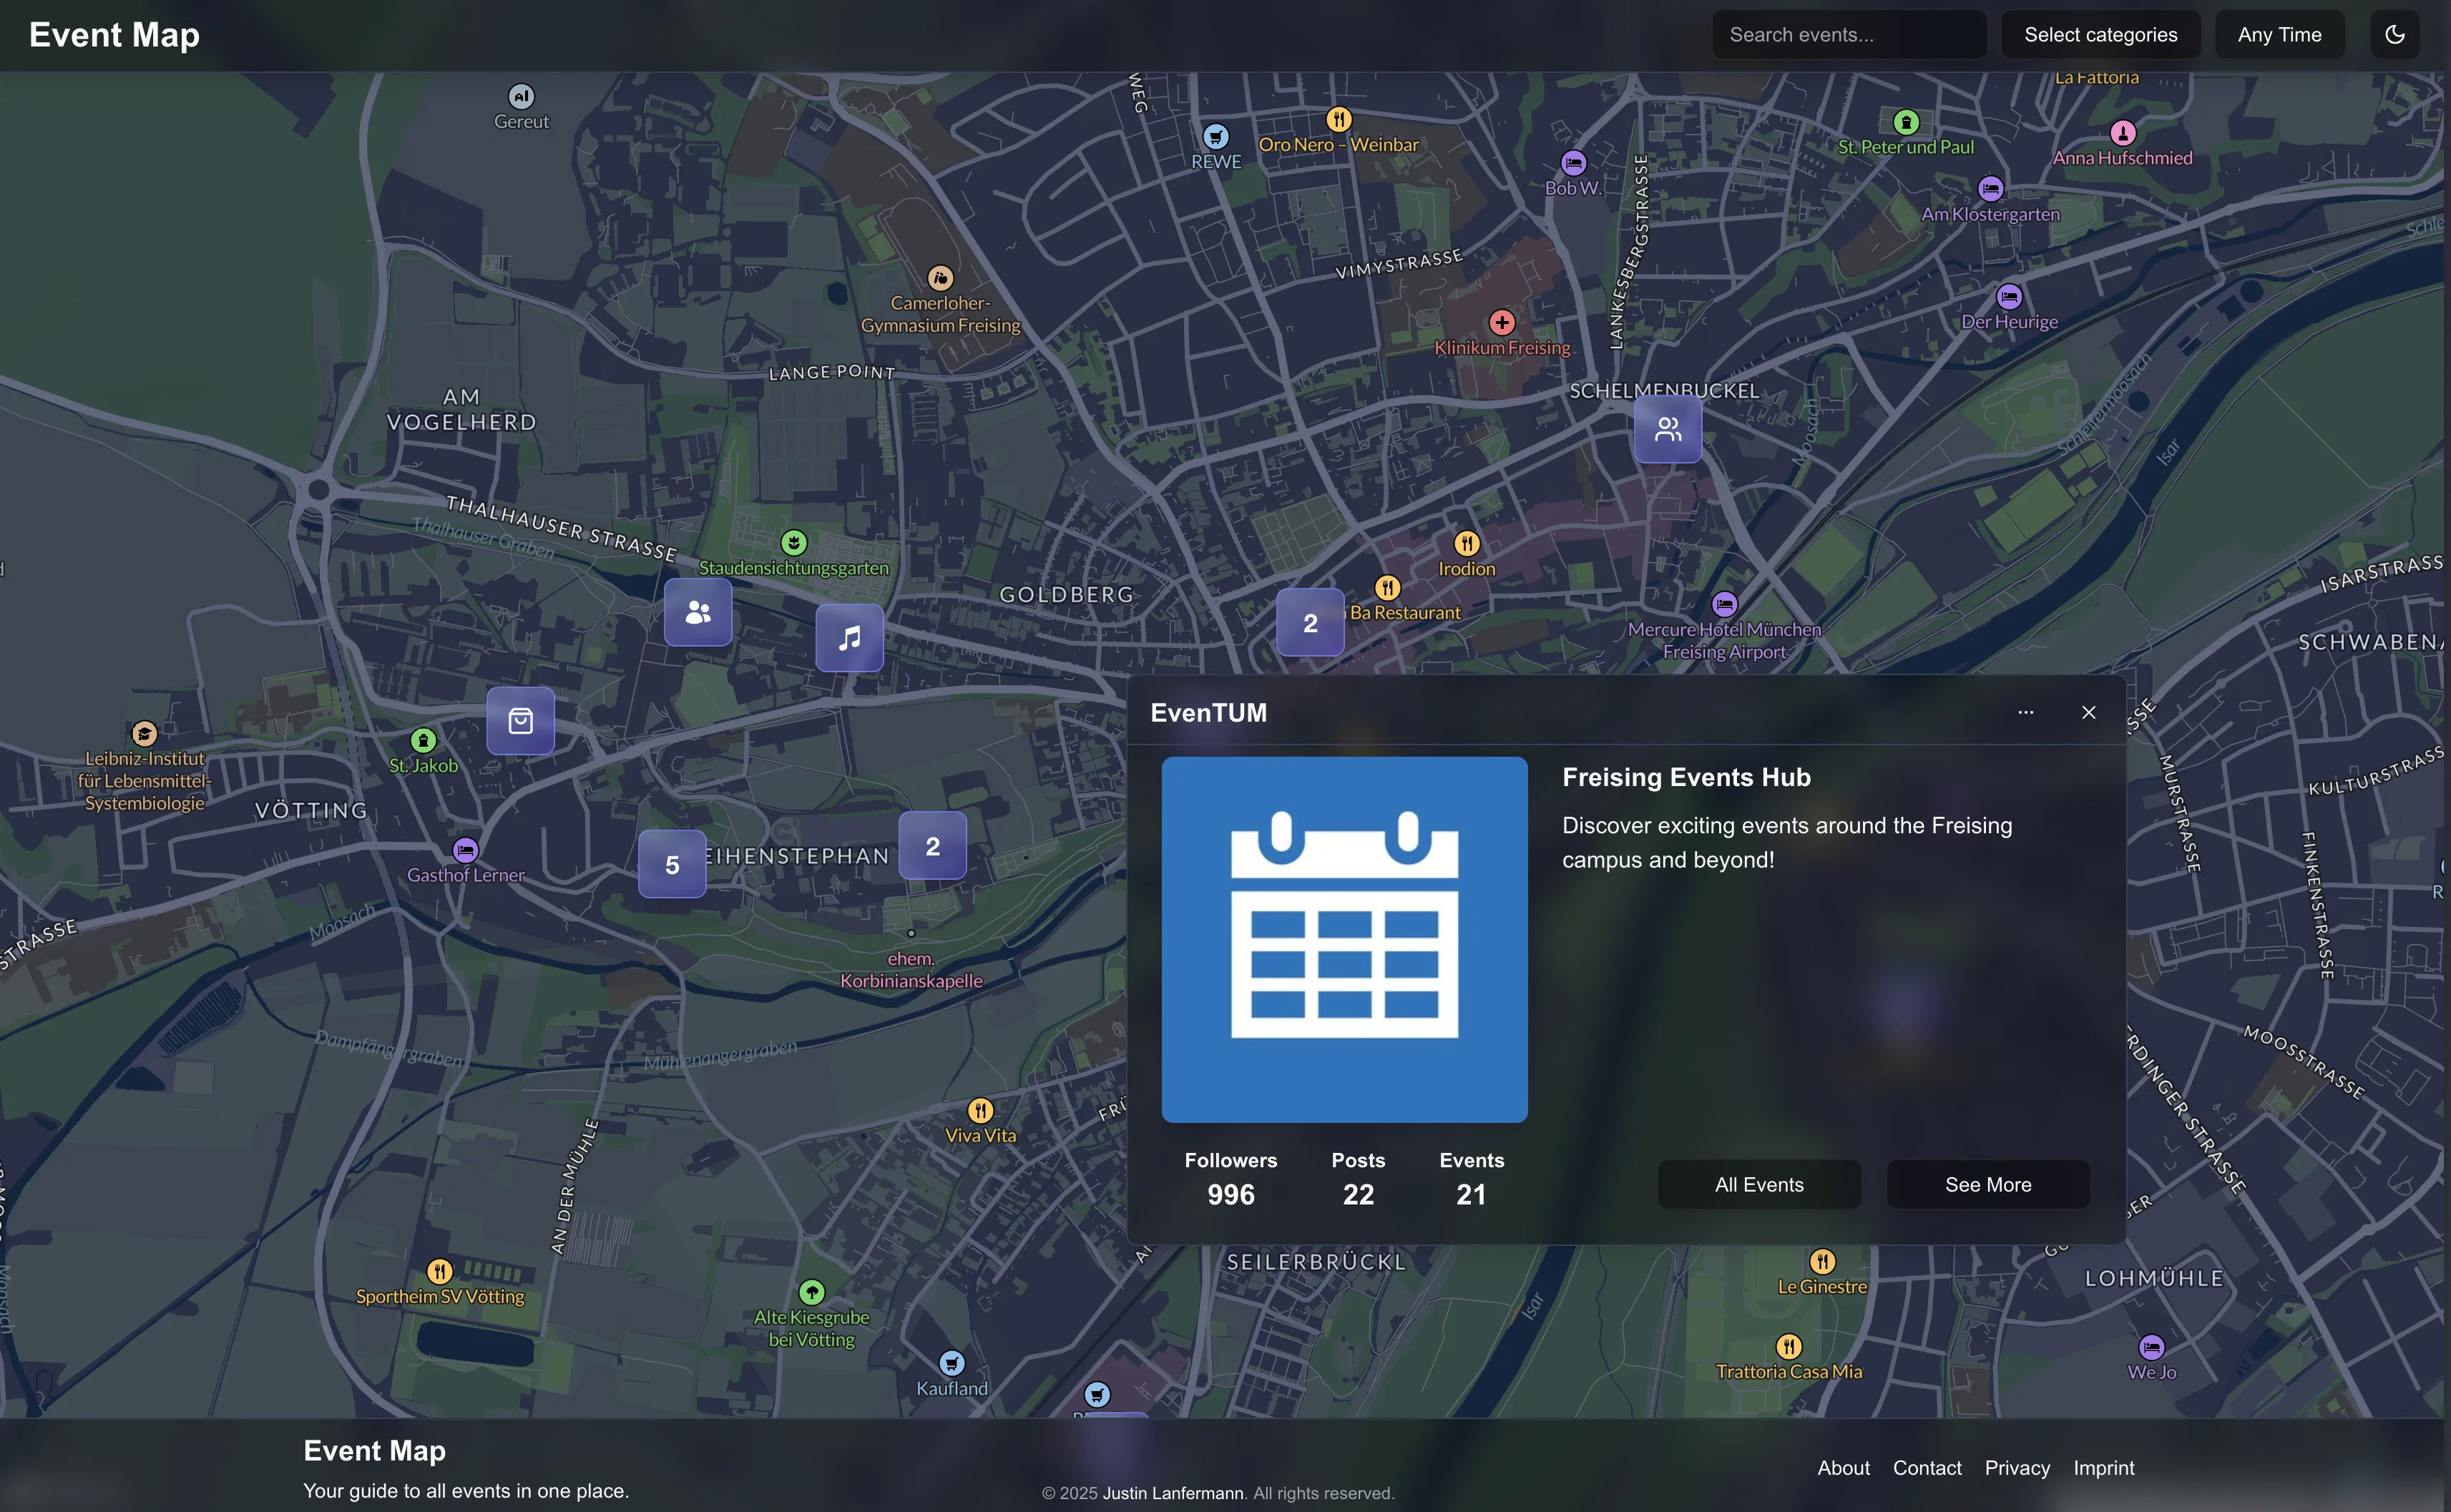
PartyMap goes beyond simple event listing by highlighting the people and organizations behind each experience. Every event connects back to its organizer, whether that's a nightclub, independent promoter, or community group. Account detail pages showcase profile images, follower counts, post statistics, and comprehensive upcoming event listings, complete with "All Events" and "See More" navigation options for deeper exploration.
Performance Optimizations and Technical Insights
Building a real-time mapping application taught me crucial lessons about web performance optimization. The system employs viewport-based data loading to fetch only visible events, debounced user interactions to prevent excessive API calls, intelligent image optimization through Next.js Image components combined with CDN delivery, and progressive disclosure patterns that load minimal event data first with detailed information available on demand.
Key Lessons and Future Development
AI excels with messy, unstructured data. Social media posts are chaotic by nature, but combining large language models with computer vision produces remarkably clean and structured event information that would be nearly impossible to extract manually.
Real-time systems demand thoughtful architecture. Building applications that continuously ingest and display live data requires careful consideration of data consistency, idempotent processing, and graceful degradation when services are temporarily unavailable.
Users crave context, not just raw information. Sophisticated filtering options, clear categorization systems, and organizer context prove just as important as the basic event data itself for creating genuinely useful discovery experiences.
Looking ahead, several exciting possibilities could enhance the platform further:
- Personalized recommendations: Machine learning algorithms that suggest events based on users' saved preferences and attendance history.
- Real-time updates: WebSocket connections to push live notifications about newly announced or cancelled events directly to active users.
- Social features: Collaborative event lists that friends can share, plus activity feeds showing what people in your network are planning to attend.
- Mobile application: Native iOS and Android apps with location-based push notifications and offline event storage for subway commutes.
Privacy and Compliance
PartyMap is a one-off technical experiment. I do not operate it publicly and do not plan to run it in production in order to comply with platform anti-scraping rules, privacy expectations, and terms of service. The work here documents architecture and learnings only.
Conclusion
PartyMap was ultimately less about shipping a production-ready product and more about pushing myself to explore what's technically possible. It challenged me to design scalable pipelines, orchestrate AI services, and craft a responsive geospatial interface, all while balancing compliance and ethical considerations. While the app itself will remain an experiment, the patterns and lessons I discovered here extend far beyond nightlife discovery. Whether applied to logistics, urban analytics, or other real-time mapping use cases, the core ideas, turning messy, fast-moving data into actionable insights, are widely transferable. I hope this deep dive inspires others to build boldly, question assumptions, and embrace experimentation in their own projects.